Paralegal Salary in Vermont: $72,574 (2026)
Quick Answer:Across Vermont's 9 metropolitan areas, the average median paralegal pay sits at $72,574/year heading into 2026 — a figure projected from 2025 BLS OEWS wage data for SOC 23-2011. Because Vermont sits at BEA RPP 103.5 (4% above the U.S. baseline), that statewide median translates to roughly $70,120 in nationally-comparable purchasing power. Highest-paying metros: South Burlington ($71,521), Burlington ($71,160), Bennington ($62,373).
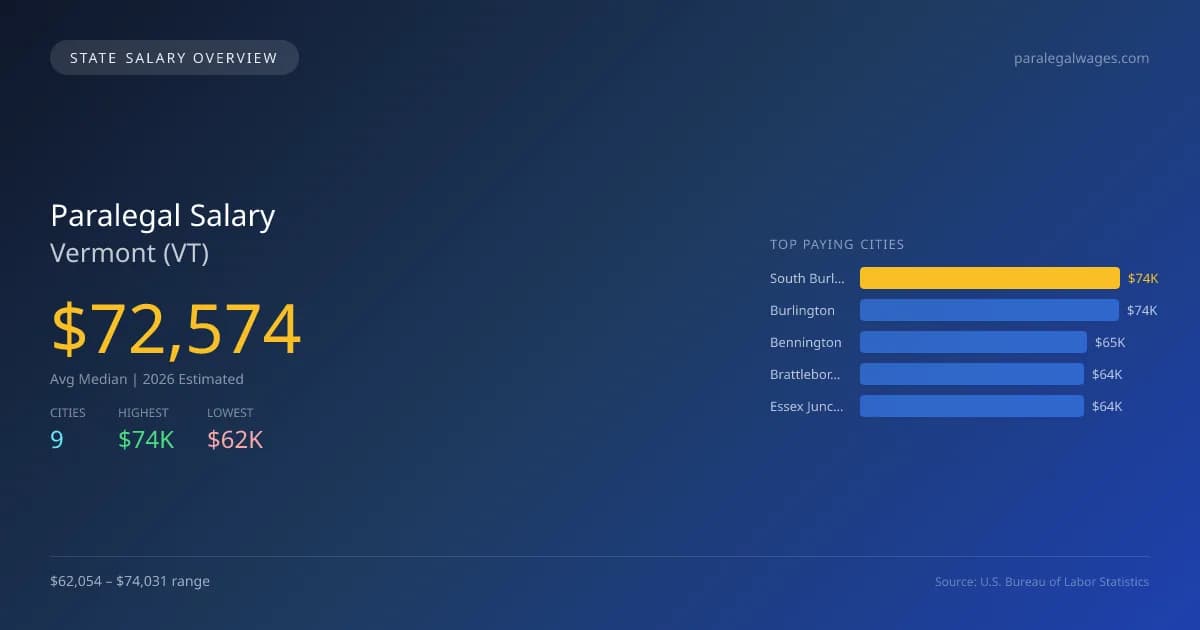
In Vermont, the average median salary for paralegals in 2026 is projected at $72,574, which exceeds the national median of $65,097 by 11.5%. This reflects a strong job market, driven by increasing demand for legal services and a projected growth rate of 3.51% annually. The highest-paying city is South Burlington, where paralegals can earn about $74,031, while the lowest is Montpelier at $62,054, indicating a salary gap of $11,977. This difference can be attributed to variances in demand for legal services, the concentration of law firms, and regional economic conditions. Vermont has specific licensing requirements and scope of practice laws that outline the roles paralegals can fill, impacting job opportunities and responsibilities. The total number of employed paralegals in the state is around 340, with major cities projected to offer salaries like Burlington at $73,658, Bennington at $64,562, Brattleboro at $63,833, and Essex Junction at $63,696. These figures highlight distinct regional dynamics within Vermont's legal market, providing insights for those considering a paralegal career in the state.
Vermont Paralegal Salary Range
Overall salary range in Vermont: $46,152 (lowest entry-level) to $114,749 (highest top earner)
Vermont vs National Average
Vermont paralegals earn 11.49% more than the national median (+$7,477/year difference).
Vermont Paralegal Salary Distribution (2026)
Paralegal salaries in Vermont range from $52,505 (entry-level, 10th percentile) to $89,605 (top earners, 90th percentile), with a median of $72,574. The Vermont median is $7,477 above the US national median of $65,097. The average hourly rate is $34.89/hr. Approximately 340 paralegals are employed across 9 cities.
2019 BLS Actual
$49,520
2025 BLS Actual
$70,113
2026 Current Est.
$72,574
2019–2027 Growth
+51.7%
Salary Trajectory for Paralegals in Vermont (2019–2027)
2019–2025: actual BLS OEWS data for this metro area. 2026+: CAGR 3.51% projection.
| Year | Annual Salary | Status |
|---|---|---|
| 2019 | $49,520 | Actual |
| 2020 | $54,150 | Actual |
| 2021 | $49,260 | Actual |
| 2022 | $61,640 | Actual |
| 2023 | $63,150 | Actual |
| 2024 | $63,577 | Actual |
| 2025 | $70,113 | Actual |
| 2026(current) | $72,574 | Estimated |
| 2027 | $75,121 | Projected |
Based on 7 years of BLS OEWS data for the Vermont metropolitan area, the median paralegal salary grew 41.6% from $49,520 (2019) to $70,113 (2025). At a 3.51% compound annual growth rate, salaries are projected to reach $75,121 by 2027 — a total increase of $25,601 (51.70%) from 2019.
Note: Historical values (2019–2025) are actual BLS OEWS figures for the Vermont metropolitan area, sourced from annual Occupational Employment and Wage Statistics surveys. 2026–2026 figures are current estimates, and 2027 values are projections, calculated using a 3.51% CAGR derived from 7-year BLS historical data. Actual salaries may vary based on employer, experience, certifications, and local market conditions.
Top 5 Highest Paying Cities in Vermont
Lowest Paying Cities in Vermont
| City | Median Salary |
|---|---|
| Montpelier | $62,054 |
| Colchester | $62,368 |
| Rutland | $62,439 |
| Barre | $63,609 |
| Essex Junction | $63,696 |
Best Value Cities for Paralegals in Vermont
When adjusted for local cost of living, these Vermont cities offer the most purchasing power for paralegals.
| City | Nominal Salary | CoL Index | Adjusted Salary |
|---|---|---|---|
| Burlington | $73,658 | 100.949 | $72,966 |
| South Burlington | $74,031 | 103.5 | $71,528 |
| Bennington | $64,562 | 103.5 | $62,379 |
| Brattleboro | $63,833 | 103.5 | $61,674 |
| Essex Junction | $63,696 | 103.5 | $61,542 |
Adjusted salary = nominal salary × (100 / CoL index). CoL index: 100 = national average. Lower index = lower cost of living.
Salary by Experience Level in Vermont
| Experience Level | Estimated Annual |
|---|---|
| Entry Level (0-2 years) | $52,505 |
| Mid Career (3-7 years) | $72,574 |
| Experienced (7+ years) | $89,605 |
Estimates based on BLS percentile data averaged across Vermont metro areas. Individual pay varies by employer, certifications, and specialization.
All 9 Cities in Vermont
| # | City | Median Salary |
|---|---|---|
| 1 | South Burlington | $74,031 |
| 2 | Burlington | $73,658 |
| 3 | Bennington | $64,562 |
| 4 | Brattleboro | $63,833 |
| 5 | Essex Junction | $63,696 |
| 6 | Barre | $63,609 |
| 7 | Rutland | $62,439 |
| 8 | Colchester | $62,368 |
| 9 | Montpelier | $62,054 |
More Vermont Salary Data
Hourly Rates
Explore paralegal hourly pay in Vermont cities.
Senior / Experienced
Top earner salaries for experienced paralegals.
Explore More Paralegal Salary Data
Frequently Asked Questions
How much do paralegals make in Vermont in 2026?
What is the highest paying city for paralegals in Vermont?
How does Vermont paralegal pay compare to the national average?
What is the entry-level paralegal salary in Vermont?
How many paralegals are employed in Vermont?
Which Vermont city offers the best value for paralegals?
Written by Jessica Tran, JD
Career Analyst
Jessica Tran has 10 years of experience in paralegal studies. She specializes in corporate law and works with a law firm. She trains new paralegals in legal research and documentation.
Methodology & Data Source
Statewide salary figures on this page are 2026 projections based on the Bureau of Labor Statistics Occupational Employment and Wage Statistics (OEWS) survey, May 2026 release. A 3.51% compound annual growth rate (CAGR), derived from 6-year national BLS wage trends, was applied to each metro area's reported salary to estimate current 2026 paralegal compensation across Vermont. State averages are employment-weighted across 9 metro areas — larger metro areas with more paralegalscontribute proportionally more to the average, producing figures that better reflect typical compensation. Individual pay varies by city, employer, certifications, and experience.
Data Sources & Methodology
Source: BLS, OEWS, 7-year dataset (–). Per-city data from annual BLS metropolitan area surveys.
2026 figures are projected from 2025 BLS data using a compound annual growth rate (CAGR) of 3.51%, derived from historical BLS wage trends for paralegals (SOC 23-2011).
Compiled and verified by Jessica Tran, JD, a licensed paralegal with 10+ years of clinical experience. · View source data at BLS.gov