Paralegal Salary in Oregon: $72,503 (2026)
Quick Answer:Across Oregon's 36 metropolitan areas, the average median paralegal pay sits at $72,503/year heading into 2026 — a figure projected from 2025 BLS OEWS wage data for SOC 23-2011. Because Oregon sits at BEA RPP 102.6 (3% above the U.S. baseline), that statewide median translates to roughly $70,666 in nationally-comparable purchasing power. Highest-paying metros: Hillsboro ($77,147), Portland ($75,430), Bend ($60,340).
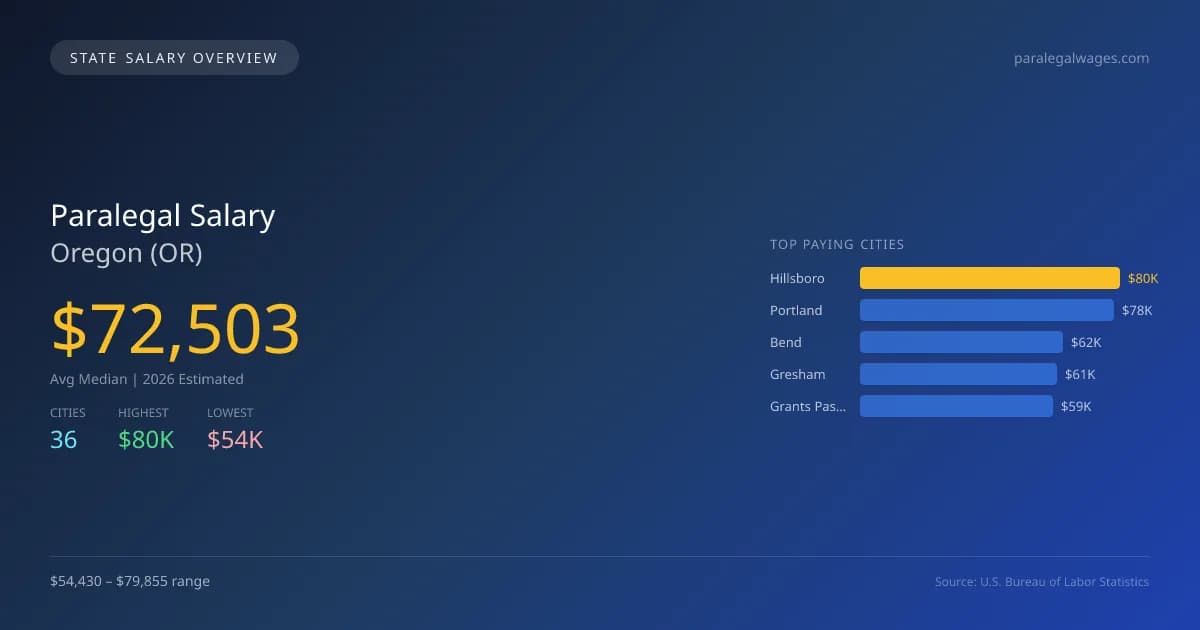
Oregon's paralegal salaries are projected to be significantly above the national average in 2026, with an average median salary of $72,503 compared to the national median of $65,097—an increase of 11.4%. In the state, Hillsboro offers the highest average salary for paralegals at $79,855, while Milwaukie has the lowest at $54,430. This disparity arises from various factors, including the cost of living, demand for paralegals in urban versus rural areas, and the concentration of legal firms in metropolitan regions. Oregon has specific licensing and scope of practice standards that influence paralegal roles. These factors, combined with a growing legal landscape, lead to increasing demand, with projected growth in the field at an annual rate of 3.51%. As many as 5,014 paralegals are expected to be employed across the state, with key cities showing strong salary prospects: Portland at $78,078, Bend at $62,458, Gresham at $60,598, and Grants Pass at $59,394. This outlook suggests steady opportunities for legal professionals, influenced by the evolving legal market and potential regulatory changes in the coming years.
Oregon Paralegal Salary Range
Overall salary range in Oregon: $39,793 (lowest entry-level) to $123,775 (highest top earner)
Oregon vs National Average
Oregon paralegals earn 11.38% more than the national median (+$7,406/year difference).
Oregon Paralegal Salary Distribution (2026)
Paralegal salaries in Oregon range from $49,876 (entry-level, 10th percentile) to $100,023 (top earners, 90th percentile), with a median of $72,503. The Oregon median is $7,406 above the US national median of $65,097. The average hourly rate is $34.85/hr. Approximately 5,014 paralegals are employed across 36 cities.
2019 BLS Actual
$57,056
2025 BLS Actual
$70,044
2026 Current Est.
$72,503
2019–2027 Growth
+31.5%
Salary Trajectory for Paralegals in Oregon (2019–2027)
2019–2025: actual BLS OEWS data for this metro area. 2026+: CAGR 3.51% projection.
| Year | Annual Salary | Status |
|---|---|---|
| 2019 | $57,056 | Actual |
| 2020 | $55,998 | Actual |
| 2021 | $58,951 | Actual |
| 2022 | $63,554 | Actual |
| 2023 | $66,647 | Actual |
| 2024 | $69,252 | Actual |
| 2025 | $70,044 | Actual |
| 2026(current) | $72,503 | Estimated |
| 2027 | $75,048 | Projected |
Based on 7 years of BLS OEWS data for the Oregon metropolitan area, the median paralegal salary grew 22.8% from $57,056 (2019) to $70,044 (2025). At a 3.51% compound annual growth rate, salaries are projected to reach $75,048 by 2027 — a total increase of $17,992 (31.53%) from 2019.
Note: Historical values (2019–2025) are actual BLS OEWS figures for the Oregon metropolitan area, sourced from annual Occupational Employment and Wage Statistics surveys. 2026–2026 figures are current estimates, and 2027 values are projections, calculated using a 3.51% CAGR derived from 7-year BLS historical data. Actual salaries may vary based on employer, experience, certifications, and local market conditions.
Top 5 Highest Paying Cities in Oregon
Lowest Paying Cities in Oregon
| City | Median Salary |
|---|---|
| Milwaukie | $54,430 |
| Klamath Falls | $54,559 |
| The Dalles | $54,888 |
| Newberg | $55,480 |
| Canby | $55,788 |
Best Value Cities for Paralegals in Oregon
When adjusted for local cost of living, these Oregon cities offer the most purchasing power for paralegals.
| City | Nominal Salary | CoL Index | Adjusted Salary |
|---|---|---|---|
| Hillsboro | $79,855 | 102.6 | $77,831 |
| Portland | $78,078 | 105.421 | $74,063 |
| Grants Pass | $59,394 | 97.76 | $60,755 |
| Bend | $62,458 | 103.607 | $60,284 |
| Gresham | $60,598 | 102.6 | $59,062 |
Adjusted salary = nominal salary × (100 / CoL index). CoL index: 100 = national average. Lower index = lower cost of living.
Salary by Experience Level in Oregon
| Experience Level | Estimated Annual |
|---|---|
| Entry Level (0-2 years) | $49,876 |
| Mid Career (3-7 years) | $72,503 |
| Experienced (7+ years) | $100,023 |
Estimates based on BLS percentile data averaged across Oregon metro areas. Individual pay varies by employer, certifications, and specialization.
All 36 Cities in Oregon
| # | City | Median Salary |
|---|---|---|
| 1 | Hillsboro | $79,855 |
| 2 | Portland | $78,078 |
| 3 | Bend | $62,458 |
| 4 | Gresham | $60,598 |
| 5 | Grants Pass | $59,394 |
| 6 | Salem | $59,239 |
| 7 | Medford | $59,208 |
| 8 | Beaverton | $58,872 |
| 9 | McMinnville | $58,713 |
| 10 | Oregon City | $58,644 |
| 11 | Eugene | $58,318 |
| 12 | Woodburn | $58,253 |
| 13 | Lake Oswego | $57,973 |
| 14 | Forest Grove | $57,821 |
| 15 | Tigard | $57,578 |
| 16 | Springfield | $57,564 |
| 17 | Redmond | $57,559 |
| 18 | Albany | $57,531 |
| 19 | West Linn | $57,393 |
| 20 | Corvallis | $57,148 |
| 21 | Tualatin | $56,897 |
| 22 | Pendleton | $56,892 |
| 23 | Wilsonville | $56,810 |
| 24 | Happy Valley | $56,322 |
| 25 | Hermiston | $56,167 |
| 26 | Central Point | $56,140 |
| 27 | Ashland | $56,136 |
| 28 | Keizer | $56,121 |
| 29 | Sherwood | $56,118 |
| 30 | Coos Bay | $56,024 |
| 31 | Roseburg | $55,819 |
| 32 | Canby | $55,788 |
| 33 | Newberg | $55,480 |
| 34 | The Dalles | $54,888 |
| 35 | Klamath Falls | $54,559 |
| 36 | Milwaukie | $54,430 |
More Oregon Salary Data
Compare Cities in Oregon
View all comparisons →Explore More Paralegal Salary Data
Frequently Asked Questions
How much do paralegals make in Oregon in 2026?
What is the highest paying city for paralegals in Oregon?
How does Oregon paralegal pay compare to the national average?
What is the entry-level paralegal salary in Oregon?
How many paralegals are employed in Oregon?
Which Oregon city offers the best value for paralegals?
Written by Jessica Tran, JD
Career Analyst
Jessica Tran has 10 years of experience in paralegal studies. She specializes in corporate law and works with a law firm. She trains new paralegals in legal research and documentation.
Methodology & Data Source
Statewide salary figures on this page are 2026 projections based on the Bureau of Labor Statistics Occupational Employment and Wage Statistics (OEWS) survey, May 2026 release. A 3.51% compound annual growth rate (CAGR), derived from 6-year national BLS wage trends, was applied to each metro area's reported salary to estimate current 2026 paralegal compensation across Oregon. State averages are employment-weighted across 36 metro areas — larger metro areas with more paralegalscontribute proportionally more to the average, producing figures that better reflect typical compensation. Individual pay varies by city, employer, certifications, and experience.
Data Sources & Methodology
Source: BLS, OEWS, 7-year dataset (–). Per-city data from annual BLS metropolitan area surveys.
2026 figures are projected from 2025 BLS data using a compound annual growth rate (CAGR) of 3.51%, derived from historical BLS wage trends for paralegals (SOC 23-2011).
Compiled and verified by Jessica Tran, JD, a licensed paralegal with 10+ years of clinical experience. · View source data at BLS.gov