Paralegal Salary in Missouri: $62,574 (2026)
Quick Answer:Across Missouri's 33 metropolitan areas, the average median paralegal pay sits at $62,574/year heading into 2026 — a figure projected from 2025 BLS OEWS wage data for SOC 23-2011. Because Missouri sits at BEA RPP 89.6 (10% below the U.S. baseline), that statewide median translates to roughly $69,837 in nationally-comparable purchasing power. Highest-paying metros: Kansas City ($63,880), St. Louis ($61,970), Independence ($50,313).
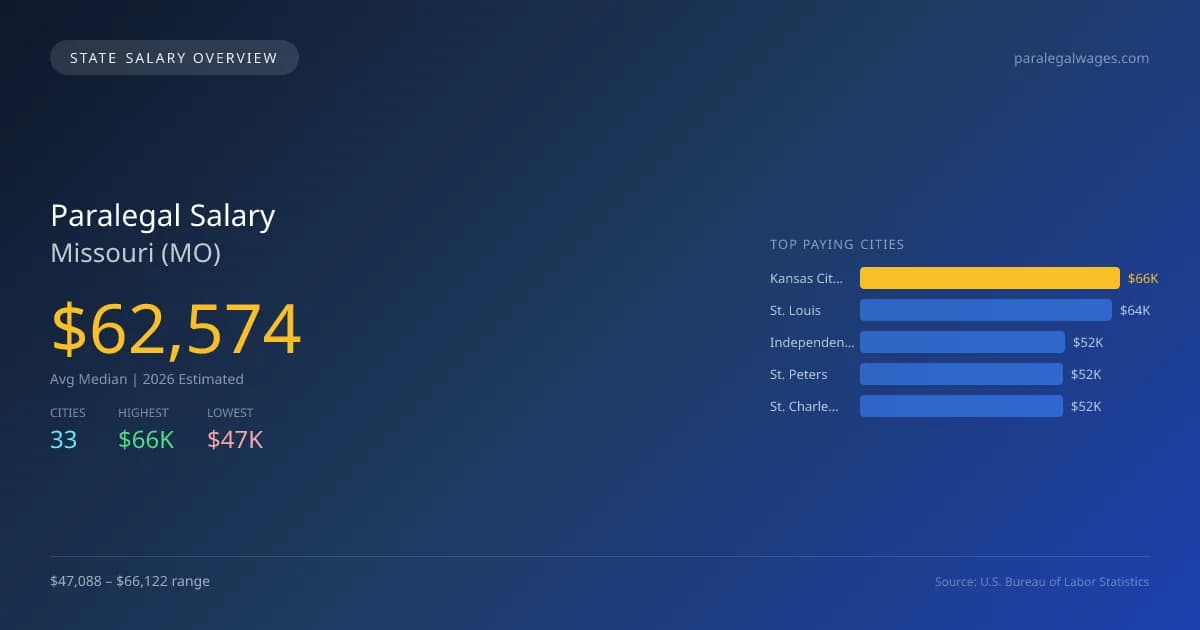
In Missouri, the average median salary for paralegals in 2026 is projected to be $62,574, which is 3.9% lower than the national median of $65,097. Salary variation across the state is significant, with the highest-paying city being Kansas City at $66,122, while Hannibal offers the lowest salary at $47,088, resulting in a notable difference of $19,034. This disparity can be attributed to factors such as local demand for legal services, the cost of living, and the concentration of law firms in metropolitan areas. Missouri does not require paralegals to have a specific state license, but it’s crucial for professionals to stay updated on state laws governing the practice, particularly regarding the scope of work they are permitted to undertake. Demand for paralegals is expected to grow at an annual rate of 3.51%, highlighting a steadily increasing need for legal support services. With 8,292 paralegals employed across 33 metro areas, job opportunities remain fairly stable, especially in larger cities like St. Louis at $64,145, Independence at $52,079, St. Peters at $51,698, and St. Charles at $51,601. As the legal landscape continues to evolve, those looking to enter the field should consider these salary trends and regional differences when planning their careers.
Missouri Paralegal Salary Range
Overall salary range in Missouri: $33,382 (lowest entry-level) to $101,326 (highest top earner)
Missouri vs National Average
Missouri paralegals earn 3.88% less than the national median ($-2,523/year difference).
Missouri Paralegal Salary Distribution (2026)
Paralegal salaries in Missouri range from $46,656 (entry-level, 10th percentile) to $98,054 (top earners, 90th percentile), with a median of $62,574. The Missouri median is $2,523 below the US national median of $65,097. The average hourly rate is $30.08/hr. Approximately 8,292 paralegals are employed across 33 cities.
2019 BLS Actual
$48,912
2025 BLS Actual
$60,452
2026 Current Est.
$62,574
2019–2027 Growth
+32.4%
Salary Trajectory for Paralegals in Missouri (2019–2027)
2019–2025: actual BLS OEWS data for this metro area. 2026+: CAGR 3.51% projection.
| Year | Annual Salary | Status |
|---|---|---|
| 2019 | $48,912 | Actual |
| 2020 | $47,917 | Actual |
| 2021 | $50,900 | Actual |
| 2022 | $55,868 | Actual |
| 2023 | $58,626 | Actual |
| 2024 | $57,849 | Actual |
| 2025 | $60,452 | Actual |
| 2026(current) | $62,574 | Estimated |
| 2027 | $64,770 | Projected |
Based on 7 years of BLS OEWS data for the Missouri metropolitan area, the median paralegal salary grew 23.6% from $48,912 (2019) to $60,452 (2025). At a 3.51% compound annual growth rate, salaries are projected to reach $64,770 by 2027 — a total increase of $15,858 (32.42%) from 2019.
Note: Historical values (2019–2025) are actual BLS OEWS figures for the Missouri metropolitan area, sourced from annual Occupational Employment and Wage Statistics surveys. 2026–2026 figures are current estimates, and 2027 values are projections, calculated using a 3.51% CAGR derived from 7-year BLS historical data. Actual salaries may vary based on employer, experience, certifications, and local market conditions.
Top 5 Highest Paying Cities in Missouri
Lowest Paying Cities in Missouri
| City | Median Salary |
|---|---|
| Hannibal | $47,088 |
| Raymore | $47,241 |
| Branson | $47,422 |
| Cape Girardeau | $47,780 |
| Belton | $48,247 |
Best Value Cities for Paralegals in Missouri
When adjusted for local cost of living, these Missouri cities offer the most purchasing power for paralegals.
| City | Nominal Salary | CoL Index | Adjusted Salary |
|---|---|---|---|
| Kansas City | $66,122 | 92.543 | $71,450 |
| St. Louis | $64,145 | 95.088 | $67,459 |
| St. Joseph | $51,507 | 86.382 | $59,627 |
| Independence | $52,079 | 89.6 | $58,124 |
| St. Peters | $51,698 | 89.6 | $57,699 |
Adjusted salary = nominal salary × (100 / CoL index). CoL index: 100 = national average. Lower index = lower cost of living.
Salary by Experience Level in Missouri
| Experience Level | Estimated Annual |
|---|---|
| Entry Level (0-2 years) | $46,656 |
| Mid Career (3-7 years) | $62,574 |
| Experienced (7+ years) | $98,054 |
Estimates based on BLS percentile data averaged across Missouri metro areas. Individual pay varies by employer, certifications, and specialization.
All 33 Cities in Missouri
| # | City | Median Salary |
|---|---|---|
| 1 | Kansas City | $66,122 |
| 2 | St. Louis | $64,145 |
| 3 | Independence | $52,079 |
| 4 | St. Peters | $51,698 |
| 5 | St. Charles | $51,601 |
| 6 | St. Joseph | $51,507 |
| 7 | Columbia | $51,124 |
| 8 | O'Fallon | $51,004 |
| 9 | Springfield | $50,937 |
| 10 | Florissant | $50,736 |
| 11 | Wildwood | $50,625 |
| 12 | Kirkwood | $50,610 |
| 13 | Lee's Summit | $50,582 |
| 14 | Chesterfield | $50,575 |
| 15 | University City | $50,309 |
| 16 | Liberty | $50,289 |
| 17 | Grandview | $50,202 |
| 18 | Maryland Heights | $50,120 |
| 19 | Blue Springs | $49,552 |
| 20 | Jefferson City | $49,519 |
| 21 | Raytown | $49,256 |
| 22 | Webster Groves | $49,011 |
| 23 | Sedalia | $48,995 |
| 24 | Ballwin | $48,907 |
| 25 | Nixa | $48,903 |
| 26 | Gladstone | $48,773 |
| 27 | Wentzville | $48,658 |
| 28 | Joplin | $48,256 |
| 29 | Belton | $48,247 |
| 30 | Cape Girardeau | $47,780 |
| 31 | Branson | $47,422 |
| 32 | Raymore | $47,241 |
| 33 | Hannibal | $47,088 |
More Missouri Salary Data
Senior / Experienced
Top earner salaries for experienced paralegals.
Compare Cities in Missouri
View all comparisons →Explore More Paralegal Salary Data
Frequently Asked Questions
How much do paralegals make in Missouri in 2026?
What is the highest paying city for paralegals in Missouri?
How does Missouri paralegal pay compare to the national average?
What is the entry-level paralegal salary in Missouri?
How many paralegals are employed in Missouri?
Which Missouri city offers the best value for paralegals?
Written by Jessica Tran, JD
Career Analyst
Jessica Tran has 10 years of experience in paralegal studies. She specializes in corporate law and works with a law firm. She trains new paralegals in legal research and documentation.
Methodology & Data Source
Statewide salary figures on this page are 2026 projections based on the Bureau of Labor Statistics Occupational Employment and Wage Statistics (OEWS) survey, May 2026 release. A 3.51% compound annual growth rate (CAGR), derived from 6-year national BLS wage trends, was applied to each metro area's reported salary to estimate current 2026 paralegal compensation across Missouri. State averages are employment-weighted across 33 metro areas — larger metro areas with more paralegalscontribute proportionally more to the average, producing figures that better reflect typical compensation. Individual pay varies by city, employer, certifications, and experience.
Data Sources & Methodology
Source: BLS, OEWS, 7-year dataset (–). Per-city data from annual BLS metropolitan area surveys.
2026 figures are projected from 2025 BLS data using a compound annual growth rate (CAGR) of 3.51%, derived from historical BLS wage trends for paralegals (SOC 23-2011).
Compiled and verified by Jessica Tran, JD, a licensed paralegal with 10+ years of clinical experience. · View source data at BLS.gov